Facts checked Article
Casino terminology
Volatility, variance and the words around a game’s statistics
Eight short entries separate measures of spread, averages, returns and probabilities. Each definition stays brief and points to the appropriate longer explanation.
Volatility / variance
Volatility describes how dispersed a game’s outcomes are. Variance is a specific mathematical measure of dispersion, based on squared distances from the mean. The words are related, but they should not be assumed to name the same numeric quantity.
The Commission’s monitoring guidance says standard deviation is most commonly used to represent game volatility.
In a casino’s game information, a label such as “high volatility” is not a variance calculation. Without the publisher’s scale and definition, it cannot be converted into an exact figure or reliably compared with another supplier’s label. Record it as the description supplied, not as a universal unit.
The distinction is between a product description and a defined statistic. Neither tells you what the next result will be. A low-volatility label is also not a statement that gambling is harmless or suitable for an individual.
For the longer discussion of return figures and sessions, read RTP and your session; this entry only fixes the vocabulary.
Sources: Live return to player performance monitoring of games of chance; 1.3.5.6. Measures of Scale.
Volatility, variance, standard deviation — what each word names
- Volatility
- Describes how dispersed a game’s outcomes are. A label such as high volatility is not a variance calculation and cannot be converted into an exact figure without the publisher’s scale and definition.Live return to player performance monitoring of games of chance · as checked on
- Variance
- A specific mathematical measure of dispersion, based on squared distances from the mean. Related to volatility, but not assumed to name the same numeric quantity.1.3.5.6. Measures of Scale · as checked on
- Standard deviation
- The Commission’s monitoring guidance says standard deviation is most commonly used to represent game volatility.Live return to player performance monitoring of games of chance · as checked on
A product description, a defined statistic and the measure the Commission says usually represents it. None tells you what the next result will be.
Variance / standard deviation
Standard deviation is the square root of variance. The distinction matters because squaring changes the units: if observations are expressed in pounds, their variance is expressed in squared pounds and their standard deviation returns to pounds. They are connected measures, not identical numbers with different names.
An invented variance of 9 squared units corresponds to a standard deviation of 3 units. That small calculation identifies the relationship only. It is not the variance of any casino game, a predicted loss or a way to choose how much to stake.
A published figure also needs its measurement basis: pounds, stake multiples or another defined unit.
If you are copying a number, copy its label and unit too. “Volatility 3” without those details is insufficient to reconstruct what was calculated. Do not square an unexplained star rating or adjective scale and call the result variance.
Odds & Ends covers the longer mathematical context; this entry is a definition and a units check.
Sources: 1.3.5.6. Measures of Scale.
Range / variance
Range is the largest value minus the smallest value in a set. Variance concerns distances from the mean across the set. Range therefore uses the extremes, whereas variance contains information about the observations between them.
A maximum-prize headline is not either of these complete statistics.
For a minimal invented comparison, take the sets 0, 0, 10 and 0, 5, 10. Each has a range of 10, although its values are arranged differently. You do not need to calculate a casino’s volatility to see that matching extremes do not describe the whole pattern.
These are abstract numbers, not a prize table or recorded play.
When a page uses “range”, check whether it actually means an observed minimum-to-maximum span, a permitted stake interval or a list of possible configurations. The label needs that object. A provider’s range of RTP settings is not a measure of outcome dispersion.
The general comparison of casino probabilities belongs with Odds & Ends, rather than a longer glossary calculation here.
Sources: 1.3.5.6. Measures of Scale.
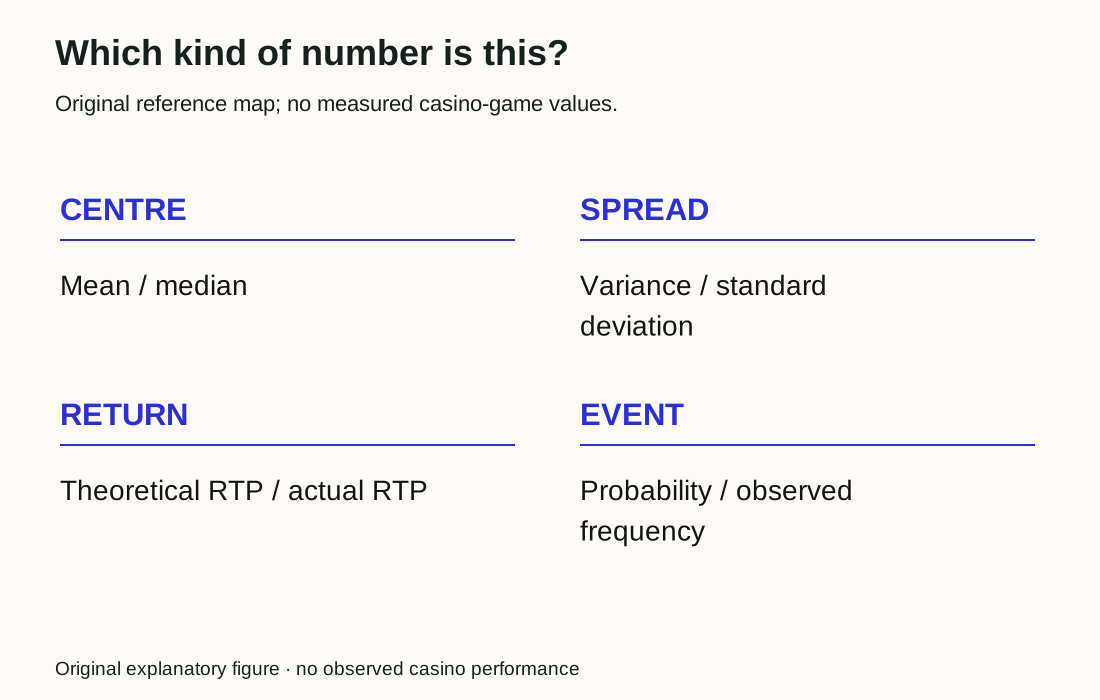
Mean / median
The arithmetic mean is the sum of observations divided by their count. The median is the middle observation once the values are ordered, or the mean of the two middle observations when the count is even. Both describe the centre of a set; neither is a measure of its spread.
With the invented values 0, 0 and 30, the mean is 10 and the median is 0. The calculation is (0 + 0 + 30) ÷ 3 = 10; the middle ordered value is 0. Calling either one simply “the typical result” would conceal which summary was used.
No real game or player dataset is represented.
For a statement about customers, sessions or payouts, ask what each observation represents before comparing averages. An average per account is not automatically an average per person. Casino Data Desk explains those measurement questions in longer form.
Here the useful distinction is centre versus spread, followed by mean versus median within the centre category.
Sources: 1.3.5.1. Measures of Location.
Theoretical RTP / actual RTP
Theoretical RTP is the designed return percentage under the relevant game conditions. Actual RTP is calculated from the returns and stakes recorded in a specified body of play. The Commission’s monitoring guidance treats them as separate measures when assessing operational game performance.
If an invented dataset contains £200 in total stakes and £180 in returns, its actual return percentage is £180 ÷ £200 × 100 = 90%. That arithmetic alone does not identify the designed RTP, establish a defect or predict another session. It describes only the supplied totals.
The dataset here is fabricated for explanation, not presented as a measurement.
The label “actual” therefore needs a period and a dataset. It does not mean a universally truer percentage that replaces the game’s design figure. A personal session is also not a substitute for an operator’s monitoring evidence.
RTP and your session covers the slot-specific interpretation; the glossary distinction is between a design quantity and an observed summary.
Sources: Live return to player performance monitoring of games of chance; Remote gambling and software technical standards (RTS) - RTS 3 – Rules, game descriptions and the likelihood of winning.
Actual RTP — the calculation on an invented dataset
The dataset is fabricated for explanation, not presented as a measurement.
Take the totals for a specified body of play
The invented dataset contains £200 in total stakes and £180 in returns.
Divide returns by stakes
£180 ÷ £200 × 100 = 90%. That is the actual return percentage for the supplied totals.
Attach the period and the dataset
The label actual needs both. It does not mean a universally truer percentage that replaces the game’s design figure.
What the result means
The arithmetic describes only the supplied totals. It does not identify the designed RTP, establish a defect or predict another session.
RTP / house edge
RTP describes the long-run share of stakes returned under the specified conditions. House edge expresses the casino’s expected retained share. When both are defined for the same game, rules and stake basis, they are complementary descriptions: an illustrative 96% RTP corresponds to a 4% house edge, because 100% − 96% = 4%.
The qualification about the same basis matters. Do not combine a headline percentage from one mode with an edge quoted for another set of rules. Neither percentage is a fee charged identically on every round, and the illustration does not promise that a £100 deposit will end as £96.
Deposits and the total amount staked are different objects.
This entry names the relationship without offering a strategy or comparing operators. How the house edge actually works supplies the longer explanation. Knowing the vocabulary does not remove the risk of losing money, and increasing play to try to approach an average is not a conclusion these definitions support.
Sources: Return to player - how much gaming machines payout; Remote gambling and software technical standards (RTS) - RTS 3 – Rules, game descriptions and the likelihood of winning.
Prize frequency / prize size
Prize frequency concerns how often a defined prize event occurs. Prize size concerns the amount awarded when it does. A paytable can describe the second without giving enough information to calculate the first.
“Up to” a particular amount is not the probability of receiving it.
Keep the event definition beside the frequency. Does the wording count any positive award, an award above the stake, or entry into a feature? Those are different events.
Without the game’s definition, a quoted frequency cannot tell you how often a player finishes a round ahead. No frequency for a named game has been verified for this article.
The quick-reference table keeps the questions separate. Its purpose is to select the correct label before looking for the number, not to infer missing odds from artwork. For the longer game-specific explanation, use Reel & Story; for any actual title, use that title’s rules.
A prominent prize amount is still only the information its document supports.
| Question | Relevant label | Insufficient substitute |
|---|---|---|
| Where is the centre? | Mean or median | Largest prize |
| How spread out? | Variance or standard deviation | An unexplained adjective |
| How often does an event occur? | Probability or defined frequency | Prize amount |
| What was returned in this dataset? | Actual RTP | Unscoped supplier headline |
Prize frequency — which event does the wording count?
Those are different events. Without the game’s definition, a quoted frequency cannot tell you how often a player finishes a round ahead.
Ticks are kept only in this browser and are never sent anywhere.
Probability / observed frequency
Probability is a model’s likelihood of an event. Observed frequency counts how often the event appeared in a particular dataset. They can be compared, but a short observed run does not automatically replace the model or establish that its probabilities changed.
In an invented record of ten events, three occurrences give an observed frequency of 3 ÷ 10 = 30%. That calculation says nothing by itself about the next event. It also does not establish a 30% designed probability.
The event definition, selection of observations and relevant model would all need to be specified.
The Commission’s standards distinguish expected probabilities from game outputs, while its monitoring guidance requires context when interpreting deviations. This glossary has not tested an RNG or analysed a game. For the mathematical treatment of independence and uncertainty, follow Odds & Ends.
The short definition ends at a disciplined sentence: “three of the ten recorded events”, rather than a claim about what a player is due next.
Sources: Remote gambling and software technical standards (RTS) - RTS 7 – Generation of random outcomes; Live return to player performance monitoring of games of chance.
Headwords in this entry
- Volatility
- How dispersed a game’s outcomes are; as a label, a description supplied by the publisher rather than a universal unit.
- Variance
- A measure of dispersion based on squared distances from the mean, expressed in squared units.
- Standard deviation
- The square root of variance, returned to the original units of the observations.
- Range
- The largest value minus the smallest value in a set; it uses the extremes only.
- Mean
- The sum of observations divided by their count; a measure of the centre, not the spread.
- Median
- The middle observation once values are ordered, or the mean of the two middle observations when the count is even.
- Theoretical RTP
- The designed return percentage under the relevant game conditions.
- Actual RTP
- The return percentage calculated from the returns and stakes recorded in a specified body of play.
- House edge
- The casino’s expected retained share, complementary to RTP when both are defined on the same rules and stake basis.
- Paytable
- The game document that describes prize sizes; it can do so without giving enough information to calculate prize frequency.
- Probability
- A model’s likelihood of an event, as distinct from how often the event appeared in a particular dataset.
- Observed frequency
- A count of how often an event appeared in a particular dataset; a short run does not replace the model.
Questions answered
What is the difference between RTP and house edge?
On the same rules and stake basis, RTP is the expected returned share and house edge is the expected retained share. The invented pair 96% and 4% illustrates their sum of 100%, not a promised session result.
Are volatility and variance the same number?
Not necessarily. Variance is a specific measure, while volatility can be a descriptive label; the Commission says standard deviation is most commonly used to represent game volatility.
What is the difference between variance and standard deviation?
Standard deviation is the square root of variance. Variance uses squared units; standard deviation uses the original units of the observations.
Does the biggest possible prize tell me how often I will receive it?
No. Prize size and event probability are different information. Read the applicable rules and do not infer an event’s frequency from its advertised maximum amount.
Is an observed return percentage the game’s theoretical RTP?
No. An observed percentage summarises a specified dataset; theoretical RTP describes the game’s designed return under stated conditions. Neither predicts an individual session.
What is the difference between range and variance?
Range is the largest value minus the smallest value in a set, so it uses the extremes. Variance concerns distances from the mean across the set and contains information about the observations between them.
What is the difference between mean and median?
The arithmetic mean is the sum of observations divided by their count; the median is the middle observation once the values are ordered. Both describe the centre of a set, and neither is a measure of its spread.
Reference sources
- Live return to player performance monitoring of games of chance
- 1.3.5.6. Measures of Scale
- 1.3.5.1. Measures of Location
- Remote gambling and software technical standards (RTS) - RTS 3 – Rules, game descriptions and the likelihood of winning
- Return to player - how much gaming machines payout
- Remote gambling and software technical standards (RTS) - RTS 7 – Generation of random outcomes
Continue reading
Return is not the same as profit
Imagine an educational example with a £10 stake and an advertised settlement of £18 including that original stake.
Read Return is not the same as profit
Wagering, turnover and the other bonus words that need separating
Short paired definitions for promotion wording: the amount wagered, the requirement, the deadline, the qualifying game and the restriction are different fields.
Read Wagering, turnover and the other bonus words that need separating
What slot has 99% RTP?: definition, and the term it is confused with
99% RTP names a game designed to return 99% of what is staked as prizes over a very large number of plays. It is not a session figure and it is not a compensated game. The Gambling Commission's pages read on 21 September 2026 name no such slot, and this entry names none.
Read What slot has 99% RTP?: definition, and the term it is confused with
What your casino account messages mean: a decoder
Twelve interface phrases from casino accounts — pending, self-excluded, verification required, bonus balance and more — defined in under 300 words each, each pointing to the site that documents the rule behind it.
Read What your casino account messages mean: a decoder
Can casinos adjust the RTP on slot machines? The RNG, and the game rules it is confused with
Not on an online slot while it is open for play in Great Britain. The RTP is set by the game rules, not the random number generator, and RTS 7D bars changing them while a game is available.
Read Can casinos adjust the RTP on slot machines? The RNG, and the game rules it is confused with
Online casino terms: a guide to commonly confused pairs
Clear distinctions between deposit and stake, return and profit, RTP and results, demo play and bonuses, with worked examples and a term selector.
Read Online casino terms: a guide to commonly confused pairs
Continue reading
What slot has 99% RTP?: definition, and the term it is confused with
99% RTP names a game designed to return 99% of what is staked as prizes over a very large number of plays. It is not a session figure and it is not a compensated game. The Gambling Commission's pages read on 21 September 2026 name no such slot, and this entry names none.
Read What slot has 99% RTP?: definition, and the term it is confused withWagering, turnover and the other bonus words that need separating
Short paired definitions for promotion wording: the amount wagered, the requirement, the deadline, the qualifying game and the restriction are different fields.
Read Wagering, turnover and the other bonus words that need separatingReturn is not the same as profit
Imagine an educational example with a £10 stake and an advertised settlement of £18 including that original stake.
Read Return is not the same as profitReturn is not the same as profit
Can casinos adjust the RTP on slot machines? The RNG, and the game rules it is confused with
What your casino account messages mean: a decoder
Wagering, turnover and the other bonus words that need separating
Online casino terms: a guide to commonly confused pairs
What slot has 99% RTP?: definition, and the term it is confused with